Estimating Concurrent Users for Load Testing With Google Analytics

For a successful load test, you need to know what metrics you’re targeting and define what success is before you begin testing. When designing a load test scenario, the first question is often to figure out how many concurrent users your real-world concurrency test should simulate. Developing an estimate of your site’s maximum concurrent users provides a starting point for defining performance goals. For a new site, this can be challenging. For an existing site, though, there are many sources of data you can work from to reason about your performance targets. Google Analytics can provide a rich source of data for estimating how many concurrent users you’ll need.
Determine load test targets
If you have a tool to parse server logs, the most accurate way to determine out your maximum concurrent users is probably by parsing the log entries or with a log viewer. You can also use Splunk to calculate this number if you’re a Splunk user. Here’s an example.
But, often a ballpark number is good enough. For that, Google Analytics works just fine.
Peak Concurrent Users
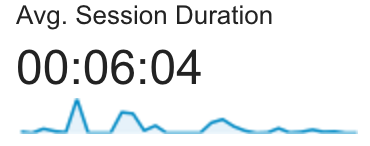
First, let’s look at your peak concurrent users. If you are using Google Analytics, jot down your average session duration. This thumbnail graph can be found on the main dashboard.
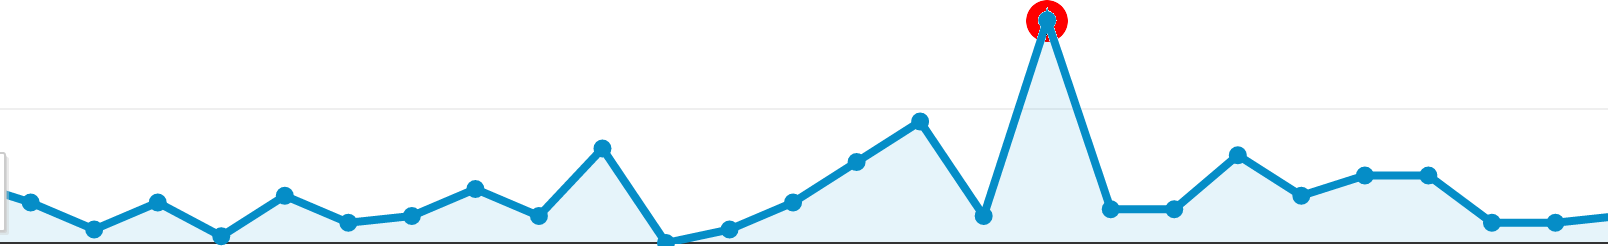
Next, select a full year in the date-selector at the top. Find your heaviest during the year. Select that day and look at the hourly numbers and find the hour with the heaviest traffic and jot down how many users that is.
Session Windows in an Hour
Let’s figure out the proportion of sessions per hour. Assuming a 6 minute session length, this looks like this:
(60 minutes / 6 minute average session length) = 10 sessions per hour
Estimate Concurrent Users
Now take the traffic for the busiest hour and work out how much of that falls into each session-sized window.
4000 hourly users / 10 sessions per hour = 400 concurrent users
That’s pretty good, but those users are not evenly distributed across the busiest hour. We’re really planning for the busiest minute in the hour, because if we undershoot and can’t handle the full weight of the traffic, people arriving during peak traffic could be deprived of our website! So let’s make some allowances to make sure our load test is both realistic, but also errs on the side of stressing the application too heavily, rather than too lightly.
Account for Some Variance
So we need to make allowance for the uneven-ness of traffic during that hour. For our fudge-factor, we’ll say 2x to account for the uneven spread. Based on what we usually see, 1.5x is typical, but 2x is safer. So 1/10 of the hourly load is 400, and we’ll use 800 as our number to ensure we’ve accounted for variance and we know we’re covered.
This concurrent users number will provide a starting point from which to reason about your performance goals.
Future-proofing
In physical engineering, engineers plan for 3x the listed max capacity. So an elevator expected to carry a maximum of 3,000 pounds will be tested to 9,000 pounds. Now, of course, software engineering is a different discipline, but the idea is the same. If you are growing, 3x or greater might make sense. Keep in mind that this base number is a starting point, and we should scale our goals up or down, as appropriate to the business objectives, targets, and SLA for your website.
If there are reasons to believe your traffic will be substantially different from historical patterns, don’t be afraid to let business expectations drive more aggressive load testing targets. Job security-wise, it is safer to over-test than under-test! That said, expectations should be plausible and based on something more than wishful thinking, and it is sometimes necessary to manage-up when expectations are out of line.